CNQR has been our client since July 2020, but our collaboration with one of CNQR’s managers started back in March 2019. It started with a small project as it usually does. We estimated a major security issue for a Wordpress website and said it will take, worst case, 8 hours to fix. We were fortunately able to fix this issue in 2 hours and billed only for the 2 hours we used for the project. A trustworthy relationship was created which has resulted in us working together with CNQR in 2020 on a series of different projects including a visualization tool.
Case
CNQR was using less sexy and inflexible methods of displaying their marketing and advertising data like Google Data Studio. Such a visualization tool is good when starting off, but reaches its limits very fast in the types of diagrams it can display and which types of diagrams can be limited only for viewing by a certain group of users. Not to talk of having the possibility of seamlessly accessing different APIs and data sources and pulling data from these sources for display. Our challenge was to create a tool which solves all these limitations and is exponentially scalable.
We had extensive briefing sessions with the colleagues at CNQR, but this this not prevent us from having major change requests during development, which is something you want to limit, except the budget of the project can be multiplied during development, which was not the case here

Solution
We conducted a series of workshops mostly video to get the required empathy and work chemistry. In the workshops we nailed down the requirements of CNQR to a tee.
We first toyed with the idea of using a ready made visualisation tool like Grafana as a base of the development but quickly ditched the idea due to the fact that we were not sure how far we could tweak and change Grafana to our needs. Grafana is a very beautiful tool and built using Angular, React and the data source can be chosen flexibly. We finally went for using different libraries for the development and patching them together into an integrated system giving ourselves maximum flexibility and control. We did compromise the speed of development with this decision, but made sure that we could develop any feature CNQR wanted, which was more important and critical to the project.
So we developed the diagrams based mainly on the D3.js which is a JavaScript library for producing dynamic, interactive data visualizations.
Before implementing the display of data with D3.js, our designer put a lot of effort designing a slick and extremely sexy design in both light and dark modes for CNQR to choose from. CNQR went with the light mood for display, but with the option of the user to be able to switch to a dark mode in a later version.
We also decided to basically create two applications in the end to ensure better scalability:
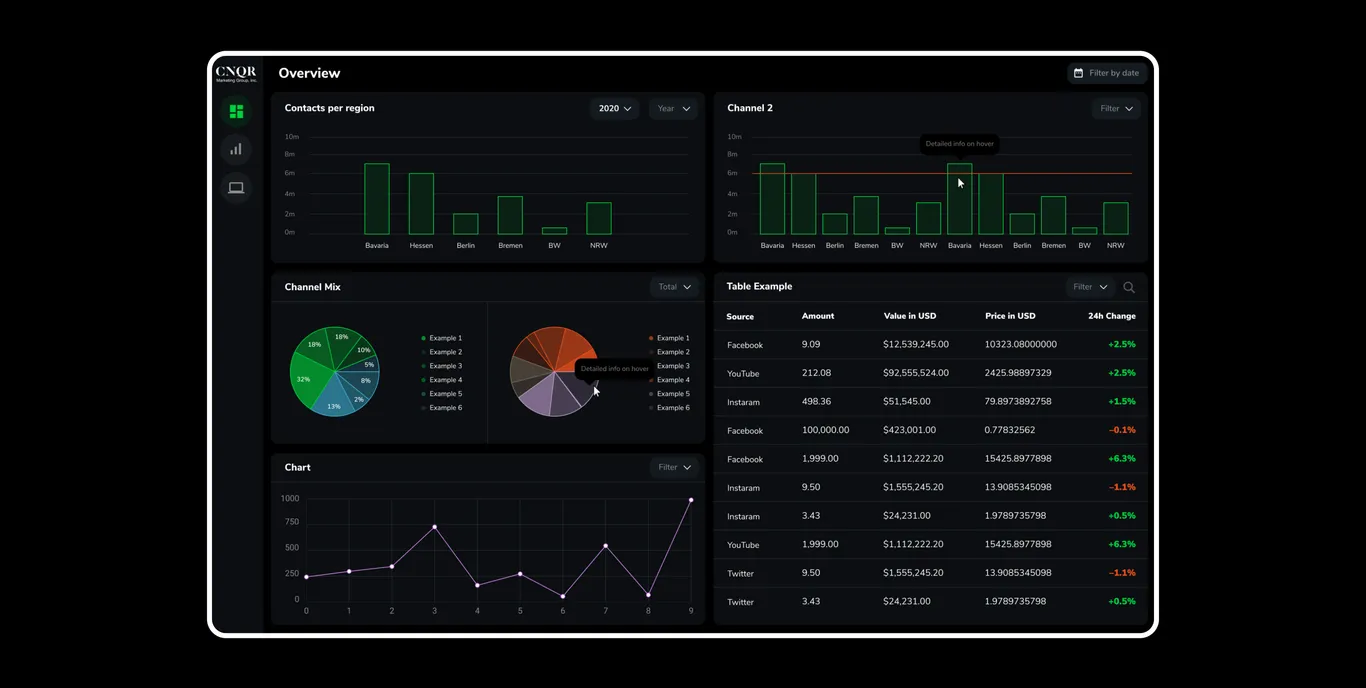
![]() One being the visualization tool itself with a login area for CNQR customers based on React.js and of course D3.js
One being the visualization tool itself with a login area for CNQR customers based on React.js and of course D3.js
![]() The other being the administration area for CNQR colleagues to be able to login and manage uploaded data and their clients who log into the visualisation tool. This area was created using Strapi, a next-gen headless CMS, enabling content-rich experiences to be created, managed and exposed to any digital device.
The other being the administration area for CNQR colleagues to be able to login and manage uploaded data and their clients who log into the visualisation tool. This area was created using Strapi, a next-gen headless CMS, enabling content-rich experiences to be created, managed and exposed to any digital device.
Another important part of the application in the administration Strapi area is an upload feature whereby data in the form of XLS documents can be uploaded into a MySQL database, which is later calculated and displayed as graphs. This data is also easily accessible and changeable via Strapi.
Technology Stack
Nature of Project
100%Remote work6 nationalitiesMembers of CNQR and our team.
Based out of:
— Spain
— Carribean Islands
— Berlin
— Serbia
Major Challenge
The amount of change requests in this project became a major issue and a misunderstanding, since we as the development team were always pointing out the change requests, but the CNQR colleagues understood this but thought it’s not going to affect the budget. Our development time became 3x the originally agreed time/estimate
After a couple of heated discussions we fortunately came to an agreement that part of the extended development time will be accounted for by CNQR and decided to monitor and report each change request more clearly in a more robust change management procedure.

About CNQR
CNQR a Programmatic Marketing and Data Driven Advertising company based in Miami USA. They empower other companies with the tools to transform their programmatic advertising. They aim to help their clients have a better grasp on their entire marketing and advertising process.
